هذا المقال غير متوفر بالعربية بعد، لذلك نعرضه بالإنجليزية.
دليل استخدام
Customer reports (new vs returning)
Purchase frequency, retention and loyalty.
The Customer data report shows how many people bought from you, how many were new and how many came back. Use it to see how often customers order again and whether your regulars keep returning.
Steps
- Open nadi.ordrio.com (your Ordrio admin panel) and log in.
- In the left menu, click Insights, then click Customer Data. The Customer data report opens and shows Today by default.
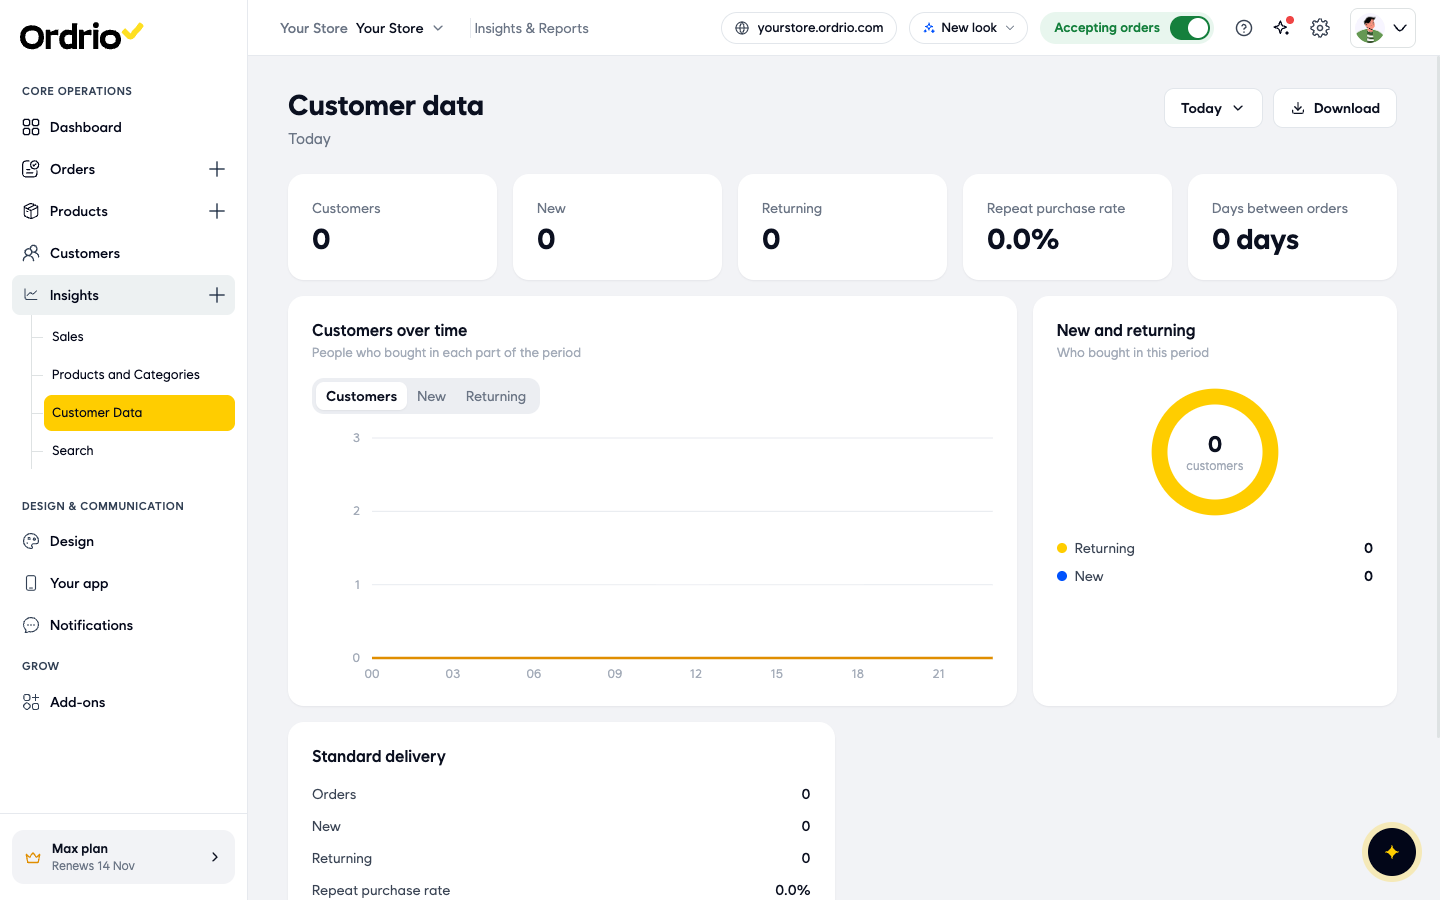
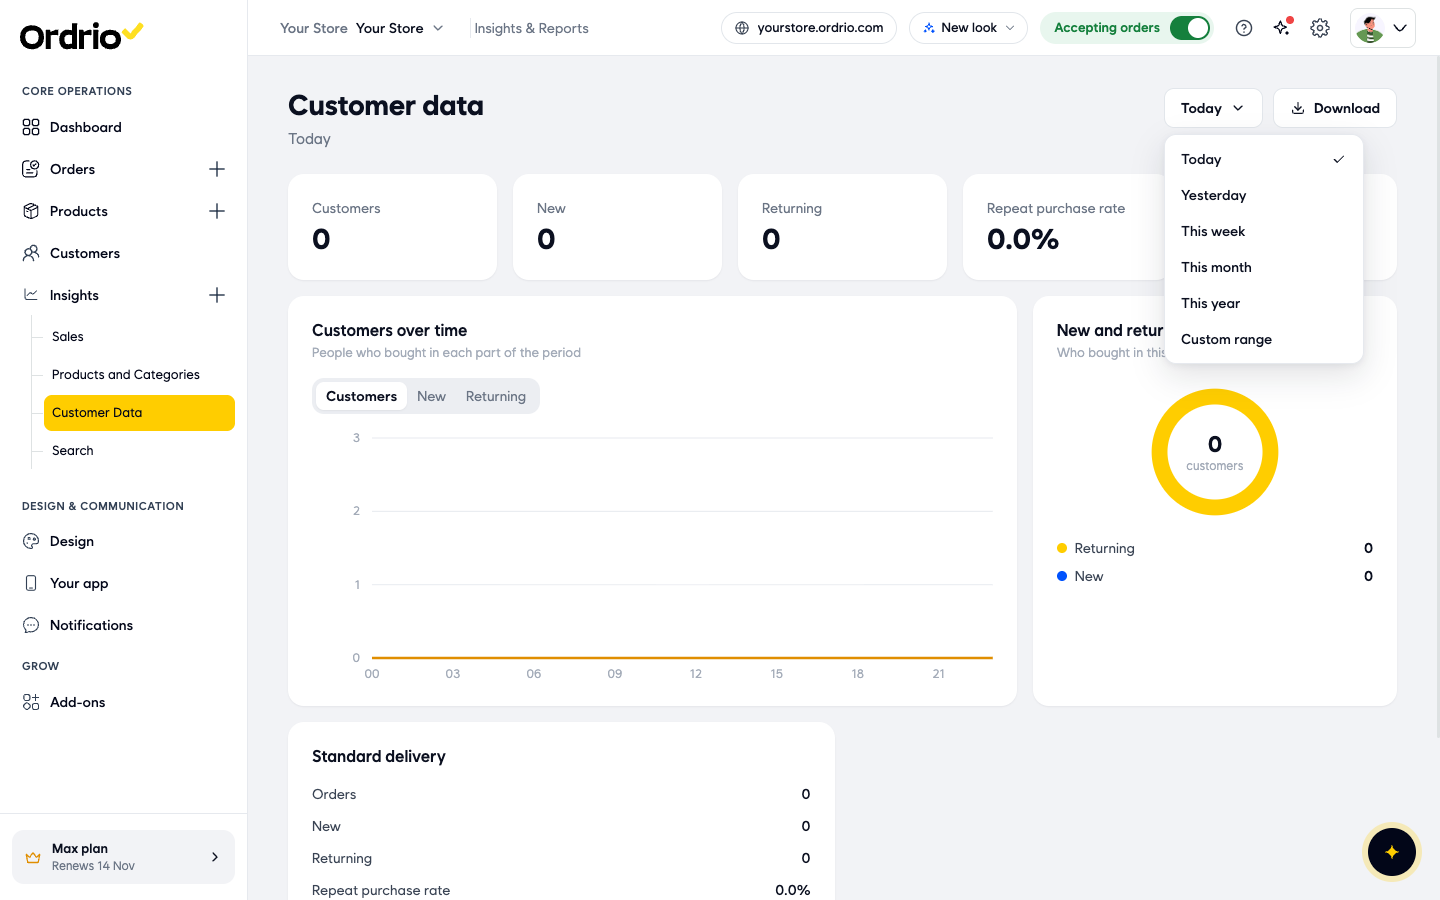
- Click the time period button at the top right (it shows Today at first). Choose Today, Yesterday, This week, This month, This year or Custom range.
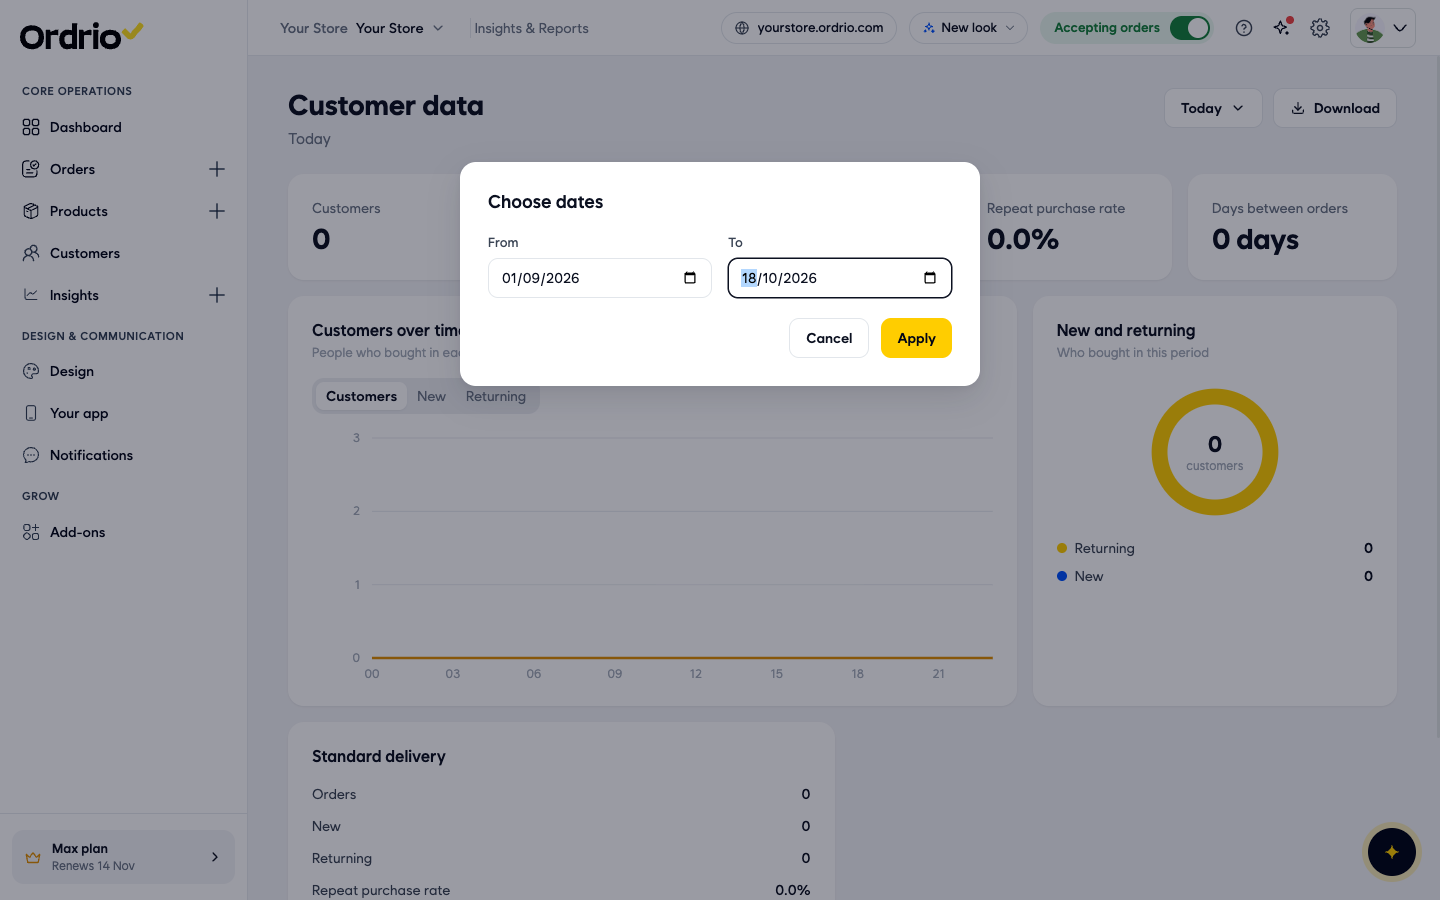
- If you chose Custom range, the Choose dates window opens. Pick a start date in From and an end date in To, then click Apply. The dates in the picture are examples, so pick the dates you want to see. The report updates and the chosen dates show under the Customer data heading.
- Read the five cards at the top of the report:
- Customers: how many people bought from you in the period.
- New: customers who were new to your store in the period.
- Returning: customers who had bought from you before.
- Repeat purchase rate: the share of customers who came back and ordered again, as a percentage.
- Days between orders: how many days usually pass between one order and the next from the same customer.
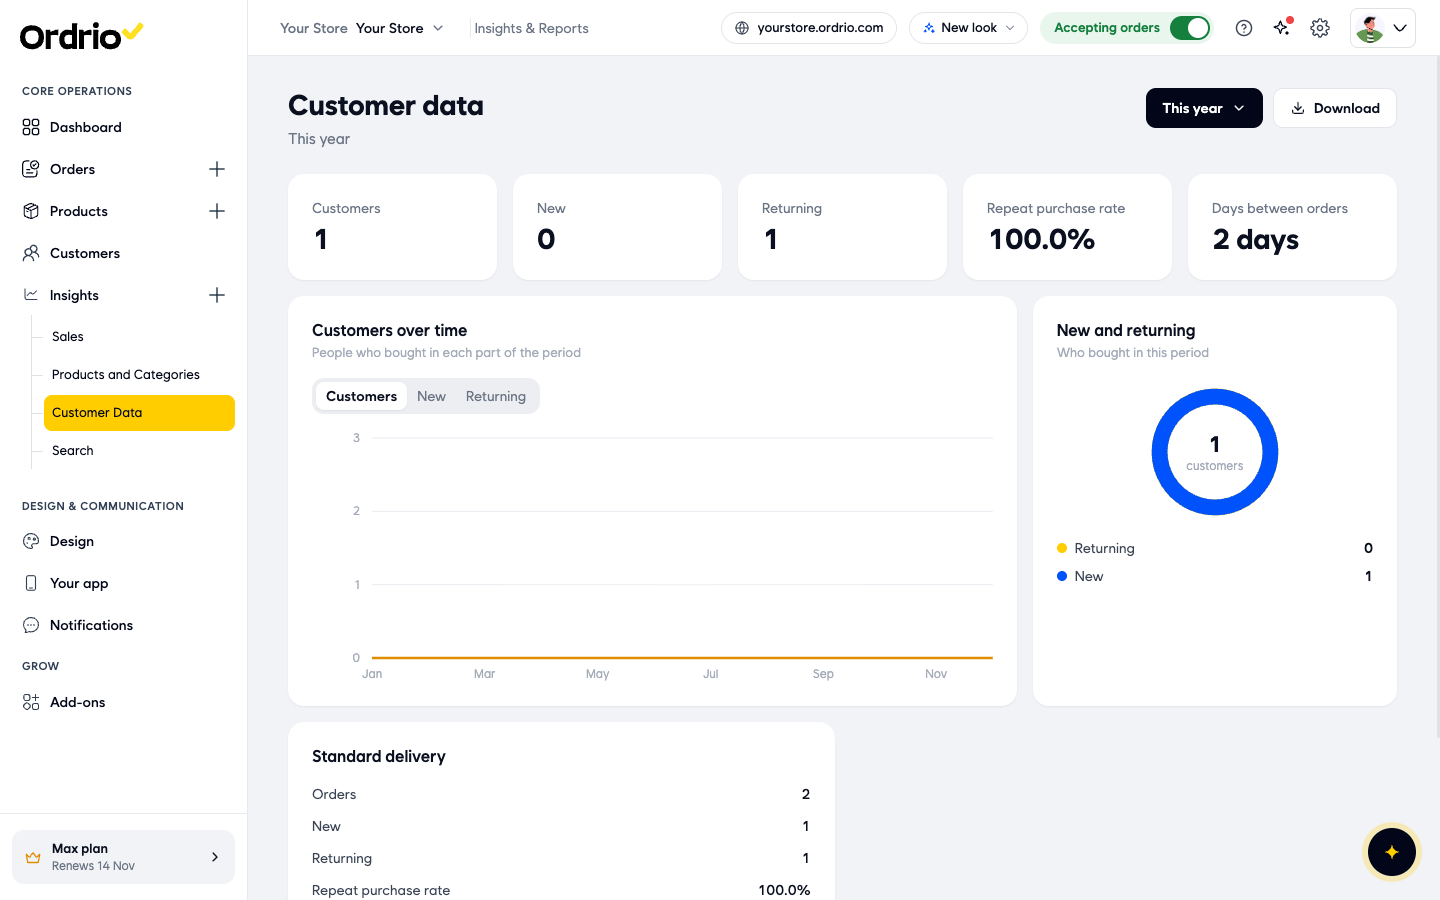
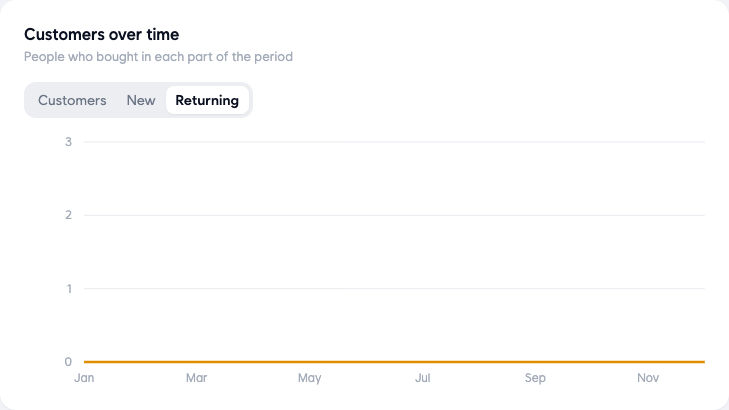
- Look at Customers over time. It shows the people who bought in each part of the period. Click Customers, New or Returning above the chart to see each group on its own. For Today the chart is split by hour, and for This year it is split by month.
- Look at New and returning, next to the chart. The circle shows the total number of customers who bought in the period, and the list below it splits them into Returning and New.
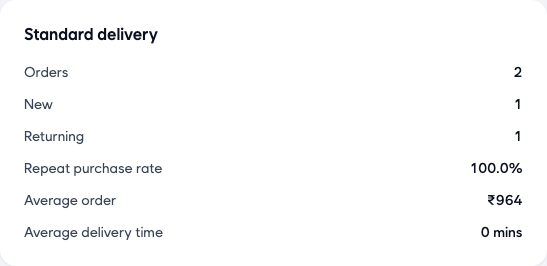
- Scroll down to Standard delivery. It shows these numbers for your standard delivery orders in the period:
- Orders: how many orders were placed.
- New and Returning: how many of those orders came from new and returning customers.
- Repeat purchase rate: the share of repeat buyers.
- Average order: the average order value, in rupees.
- Average delivery time: the average time, in minutes, to deliver an order.
- To keep a copy of the report, click Download at the top right. It uses the time period you have chosen.
Purchase frequency
Purchase frequency tells you how often your customers buy.
- Check Days between orders. A small number means customers order often. For a daily milk or tiffin business, you would expect it to be low.
- Use Customers over time to see which days, weeks or months bring the most buyers.
- Compare This month with a Custom range for the month before to see if customers are ordering more often.
Retention
Retention tells you how many customers come back after their first order.
- Returning shows how many customers had bought from you before.
- Repeat purchase rate shows the same thing as a percentage. If it drops, fewer customers are coming back.
- Click the Returning tab in Customers over time to see when returning customers bought.
Loyalty
Loyal customers are the ones who keep coming back again and again.
- A high Repeat purchase rate and a low Days between orders over a long period, such as This year, are signs of loyal customers.
- To reward them, you can switch on the Loyalty add-on in Add-ons. With it, customers earn coins on orders and spend them next time. Loyalty is a paid add-on.
Good to know
- The report shows Today each time you open it. Choose a longer period, such as This month or This year, to see useful trends.
- A short period, such as Today, often shows 0 for every card if no one has ordered yet. This is normal.
- If you run more than one branch, use the branch switcher at the top of the admin panel to choose the branch you want to see.
- The report shows numbers only. To see a single customer's orders and details, open Customers in the left menu.
Related
- Sales and revenue reports
- Product, category and SKU performance
- Loyalty points and rewards
- Enabling and managing add-ons
هل كان هذا المقال مفيداً؟