هذا المقال غير متوفر بالعربية بعد، لذلك نعرضه بالإنجليزية.
دليل استخدام
Sales and revenue reports
Sales trends, order volumes and revenue over time.
The Sales report shows how much you sold, how many orders you got and how that changes over time. Use it to spot busy days, compare one period with the one before, and see where your sales come from and how customers pay.
Before you start
The report fills in as orders come in. If your store has no orders yet, every number shows 0.
See your sales report
- Open nadi.ordrio.com (your Ordrio admin panel) and log in.
- In the menu on the left, click Insights, then click Sales. The Sales page opens and shows Today compared with yesterday.
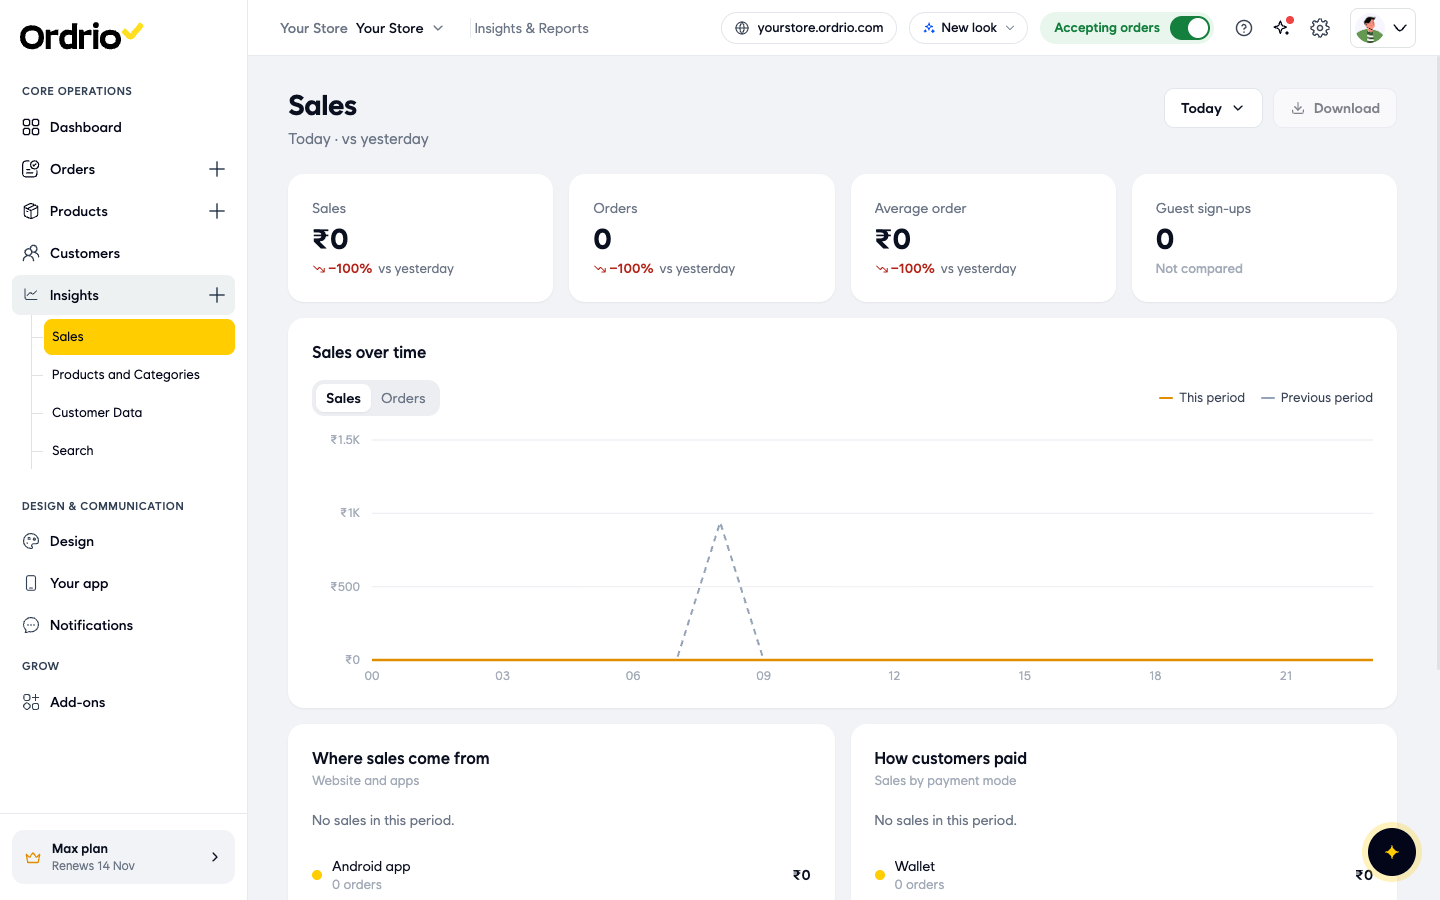
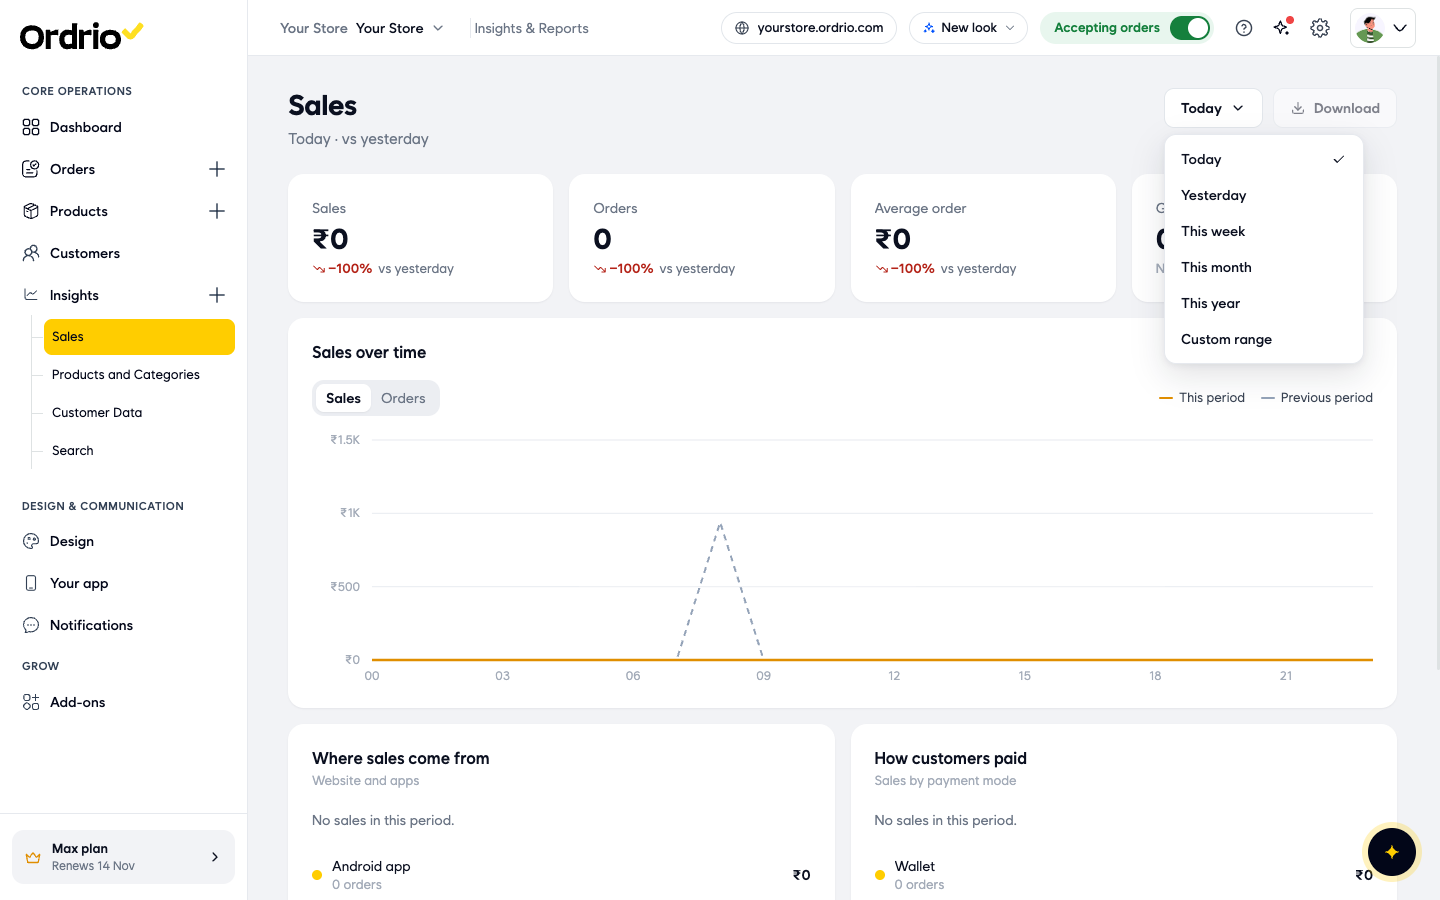
- To change the dates, click the time period button at the top right (it shows Today at first). Choose Today, Yesterday, This week, This month, This year or Custom range.
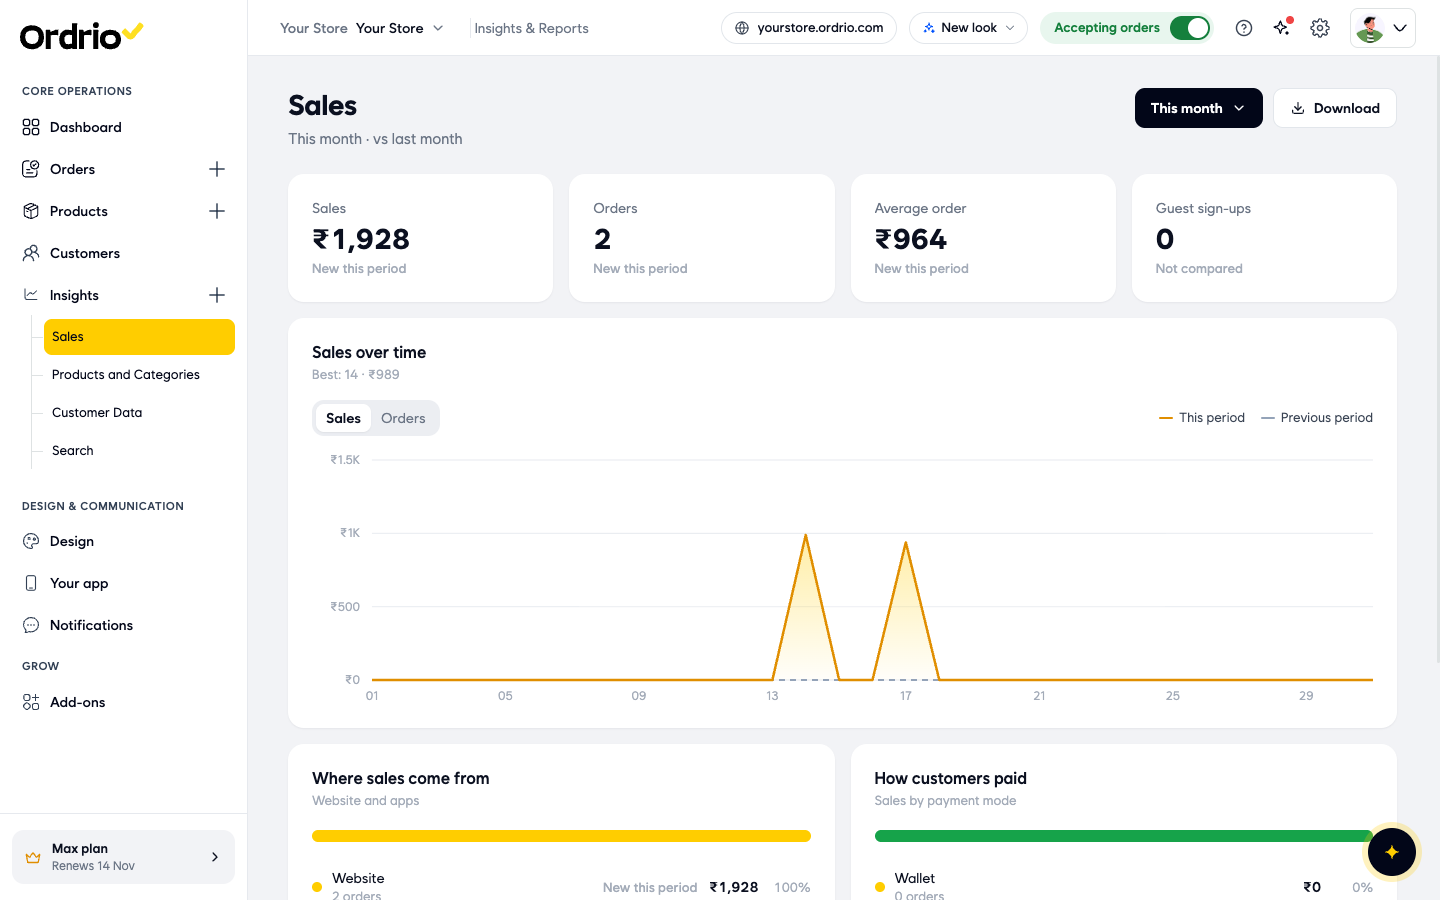
- Read the four boxes at the top. The line under the title shows which period you are looking at and what it is compared with, for example "This month · vs last month".
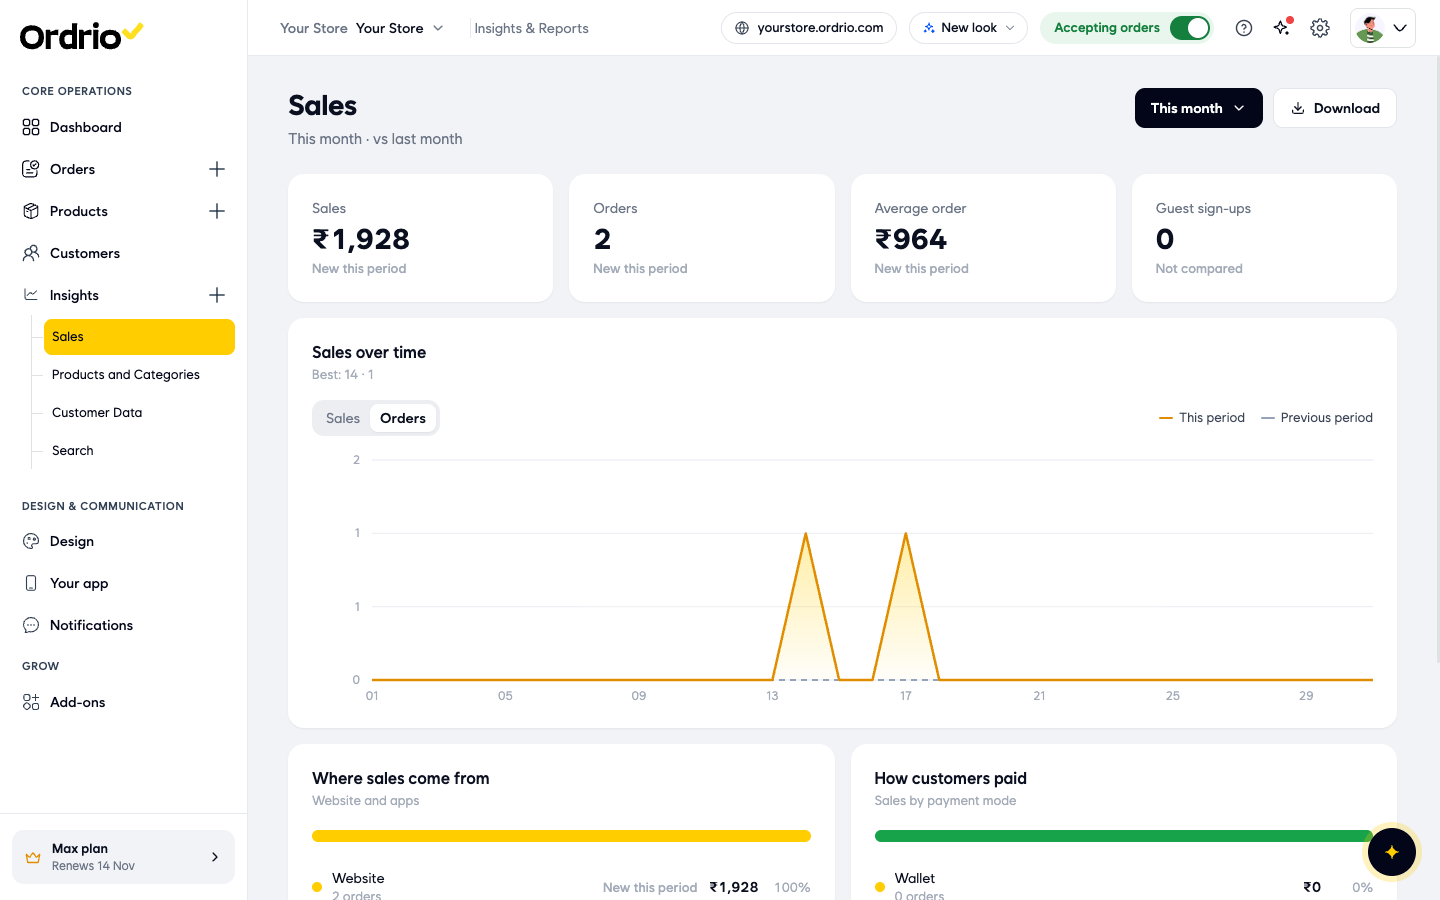
- To see order volumes instead of revenue, click Orders above the Sales over time chart. Click Sales to switch back to revenue.
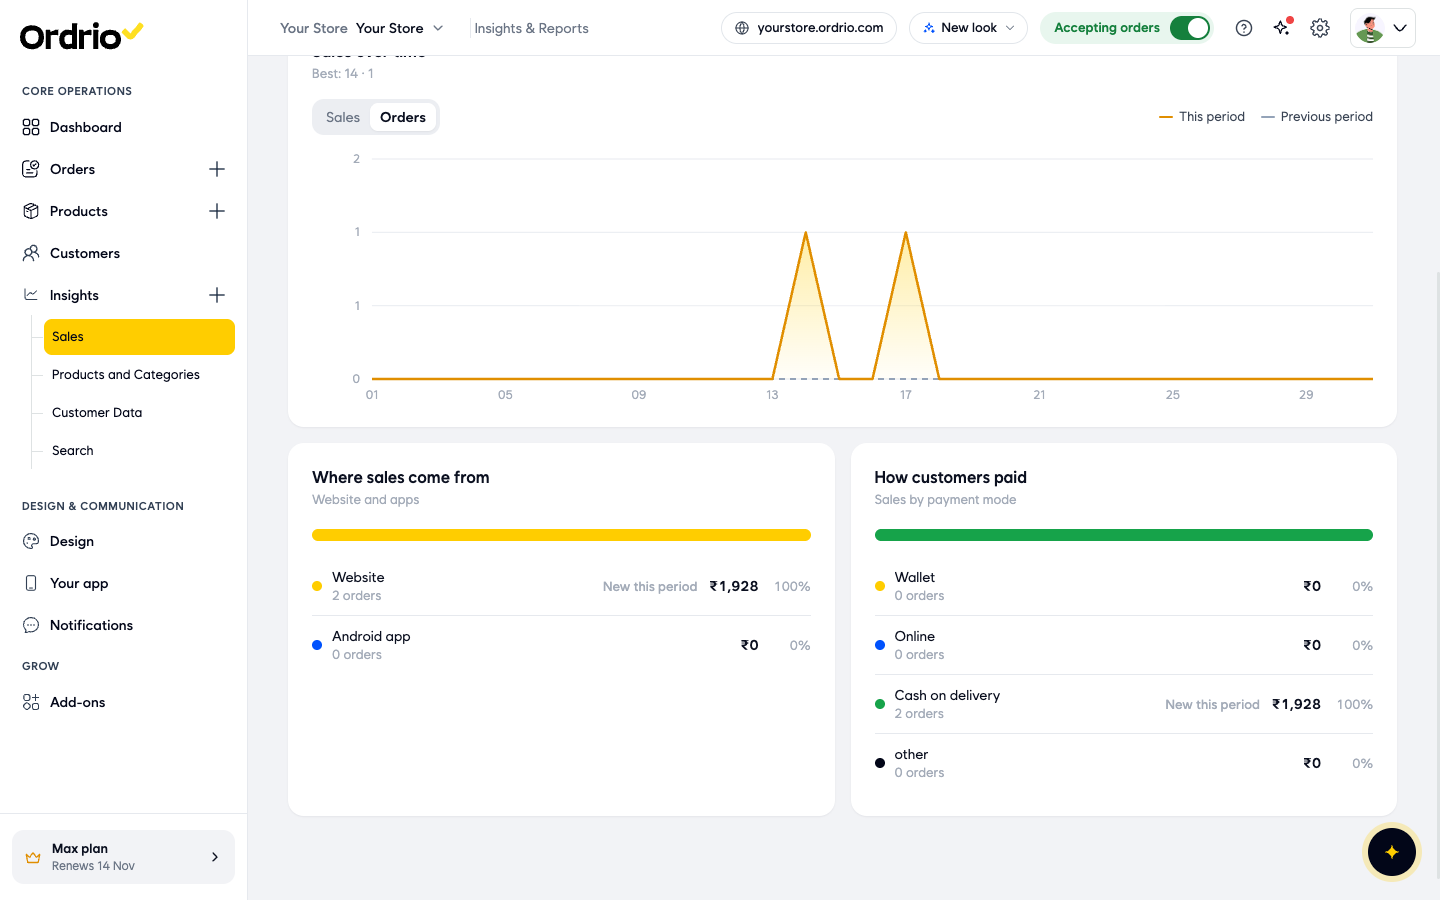
- Scroll down to see Where sales come from and How customers paid.
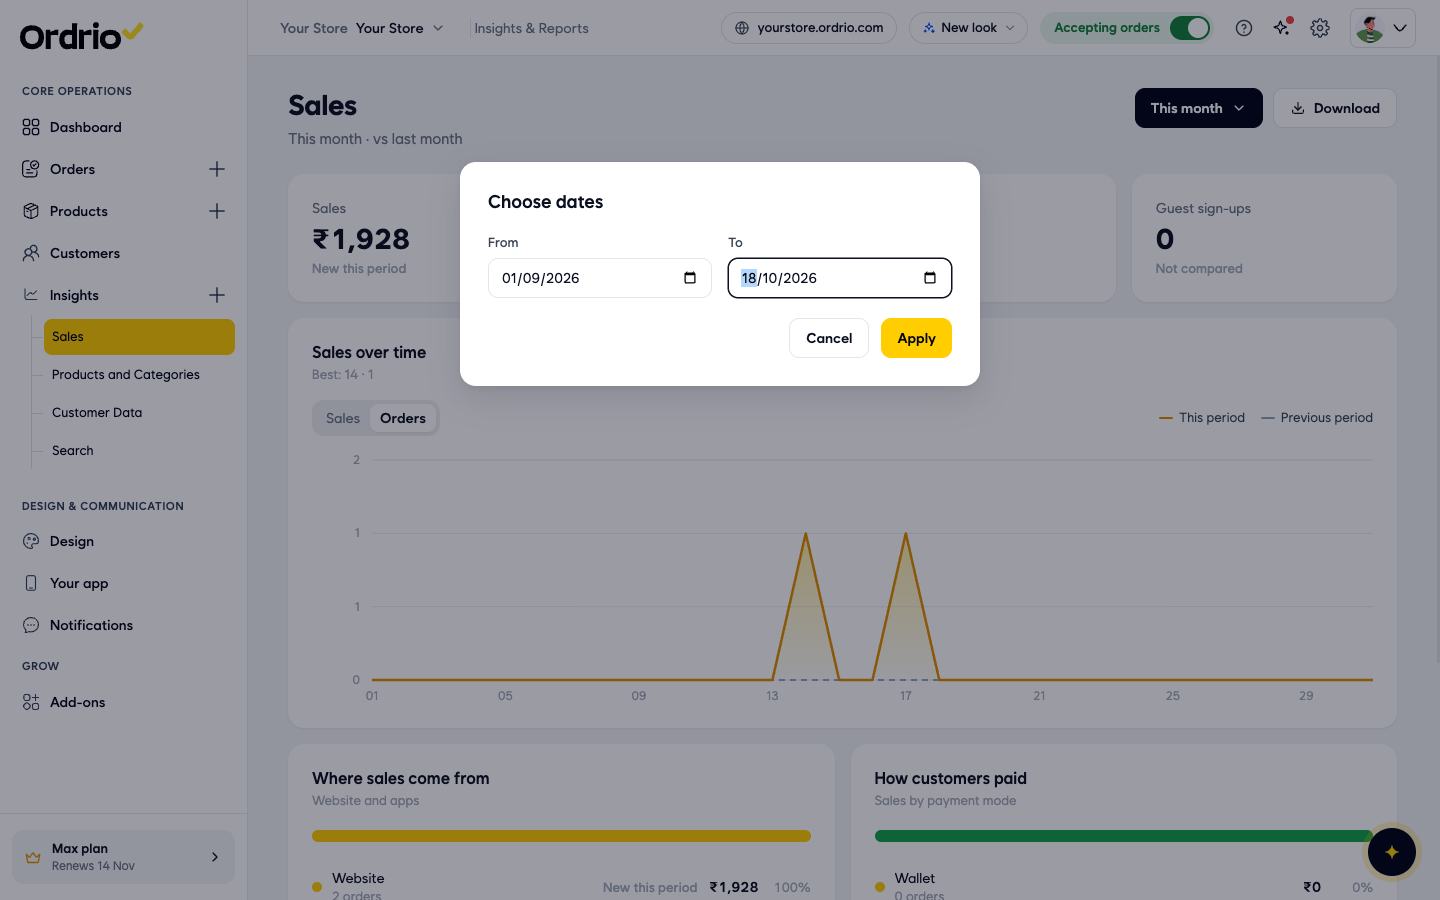
- To look at your own dates, click the time period button and choose Custom range. In Choose dates, pick a From date and a To date, then click Apply. Click Cancel to close it without changing anything.
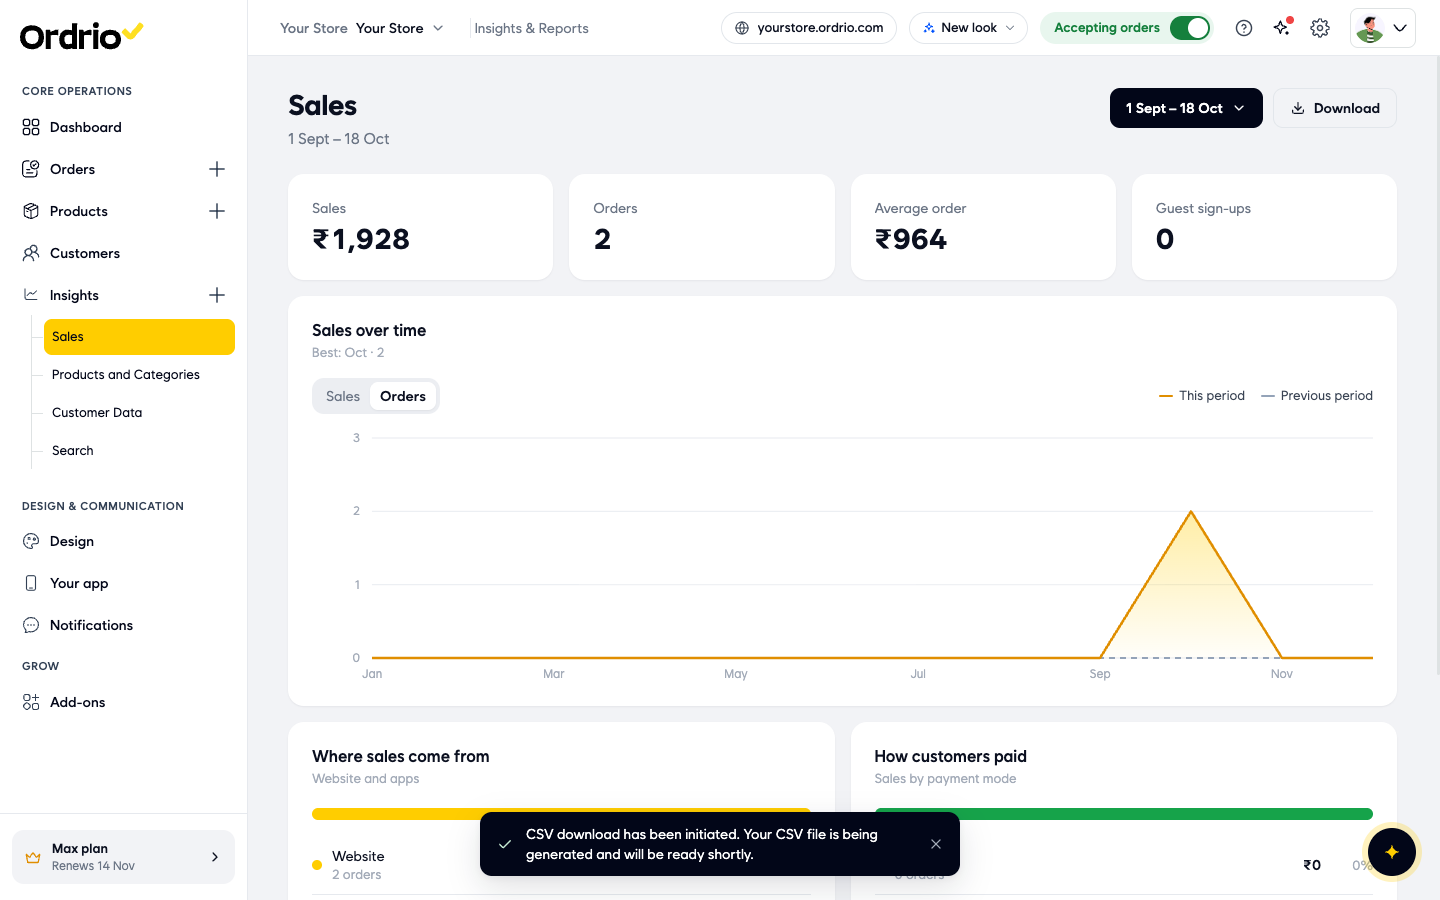
- To save the report as a file, click Download. Ordrio shows the message "CSV download has been initiated" and prepares a CSV file of the period you chose.
What each part of the report shows
Summary boxes
- Sales: the total value of orders in the period.
- Orders: how many orders you got in the period.
- Average order: the average value of one order (sales divided by orders).
- Guest sign-ups: how many guest customers signed up in the period. This box is not compared with the previous period.
Under each box you see the change from the previous period, for example "−100% vs yesterday" in red when sales went down. "New this period" means there were no sales in the previous period to compare with.
Sales over time
This chart shows your sales trend across the period you chose.
- Sales shows revenue. Orders shows the number of orders.
- The orange line is This period. The grey dashed line is Previous period, so you can compare the two at a glance.
- "Best" under the chart title shows your best point in the period, for example "Best: 14 · ₹989" means the 14th was your best day with ₹989.
- The chart steps change with the period: hours for Today and Yesterday, days of the week for This week, dates for This month, and months for longer periods.
Where sales come from
Shows sales from your Website and your apps (for example Android app). For each one you see the number of orders, the sales amount and its share of your total.
How customers paid
Shows sales by payment mode: Wallet, Online, Cash on delivery and other. For each one you see the number of orders, the sales amount and its share of your total.
Good to know
- The numbers on these screenshots are examples. Your report shows your own store's sales.
- Custom range only lets you pick dates up to today. A custom range is not compared with a previous period.
- Download can be greyed out when there are no sales in the period you chose. Pick a period with orders to download it.
- When the report shows "No sales in this period", try a longer period such as This month.
- Under Insights you also find Products and Categories, Customer Data and Search for other reports.
Related
- Product, category and SKU performance
- Customer reports (new vs returning)
- Viewing and managing orders