How-to guide
Product, category and SKU performance
Find your best and worst sellers.
The Products and Categories report shows which products and categories sell the most, and which sell the least, for any time period. Use it to decide what to stock more of, what to promote and what to drop.
Before you start
The report is built from your orders. If your store has no orders in the time period you choose, the lists will be empty.
See your top products and categories
- Open nadi.ordrio.com (your Ordrio admin panel) and log in.
- In the left menu, click Insights, then click Products and Categories. The Products & categories page opens with two cards:
- Top products (by items sold): your best sellers, ranked 1, 2, 3 and so on. Each one shows the product name, its size or pack (for example "1L Carton") and how many were sold.
- Top categories (share of items sold): each category with its number of orders, the items sold and its share of all items sold as a percentage. The coloured bar shows how the share is split between categories.
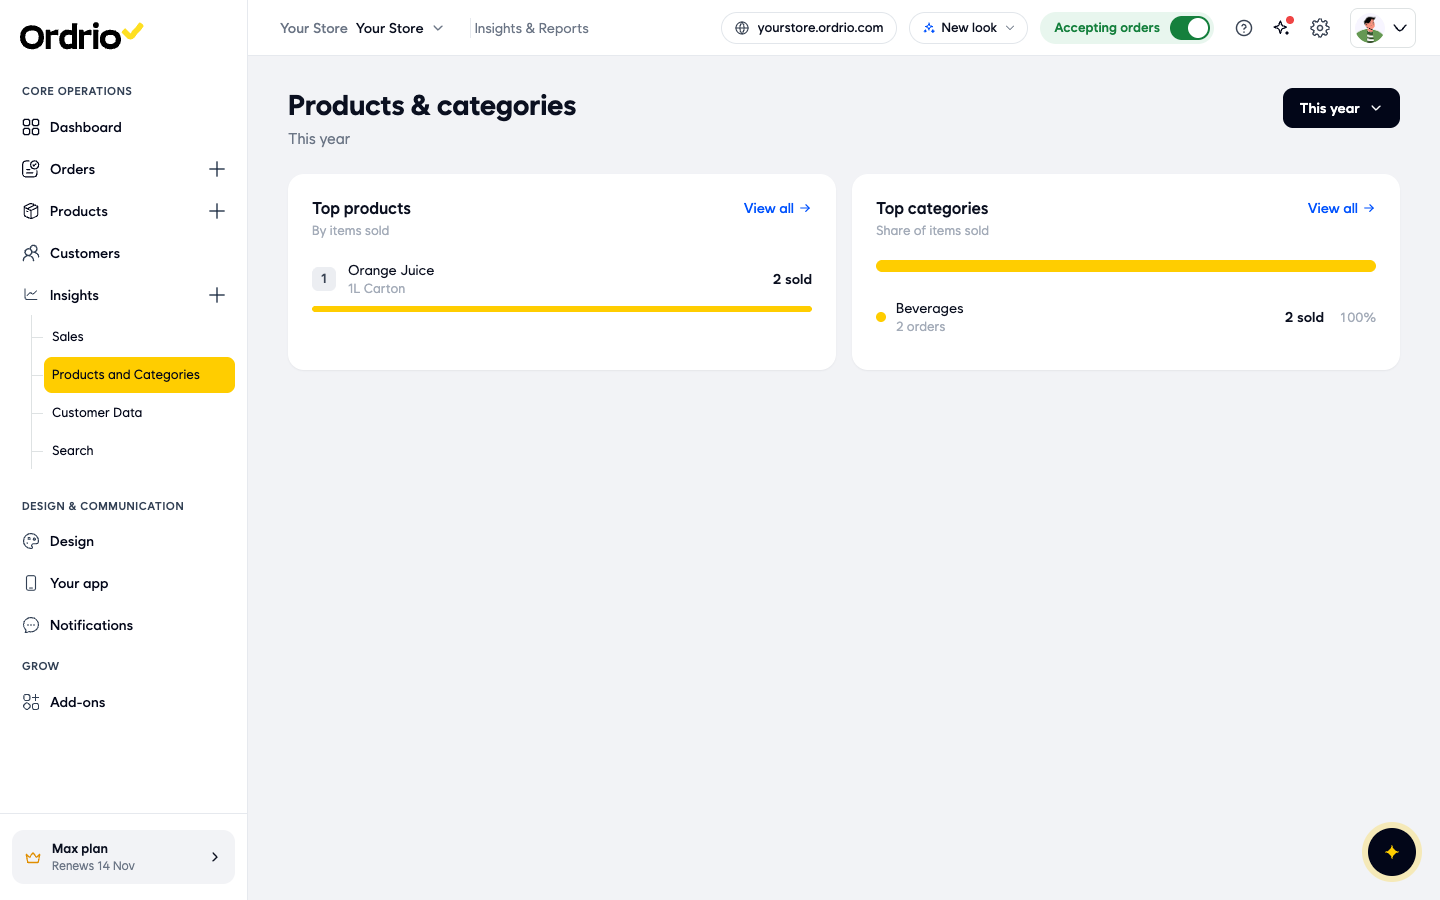
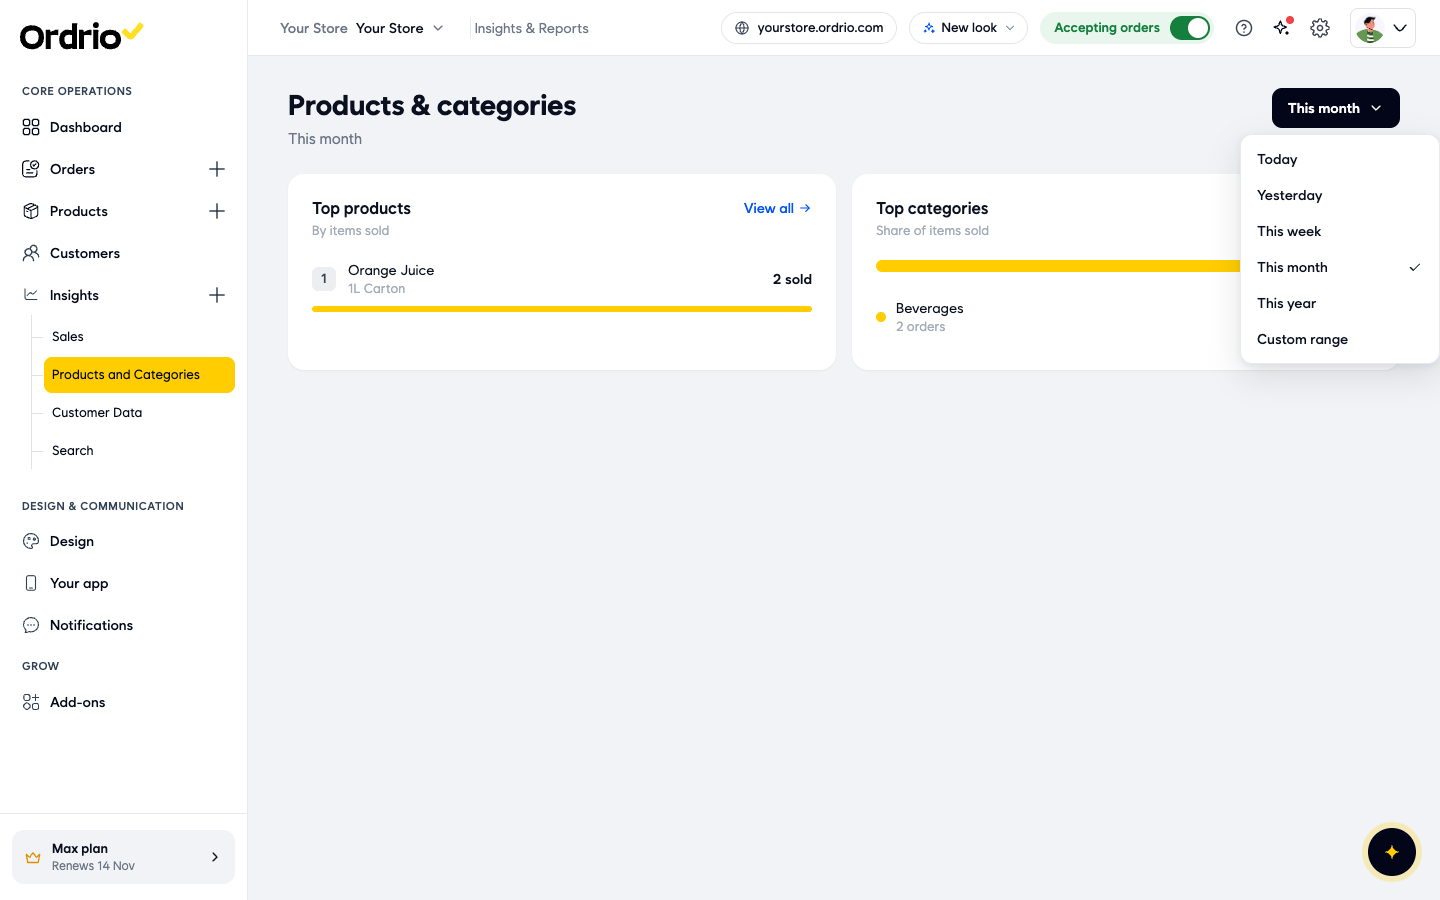
- Click the time period button at the top right and pick a period: Today, Yesterday, This week, This month, This year or Custom range. Both cards update to that period, and the period is shown under the page title.
Find your best and worst selling products
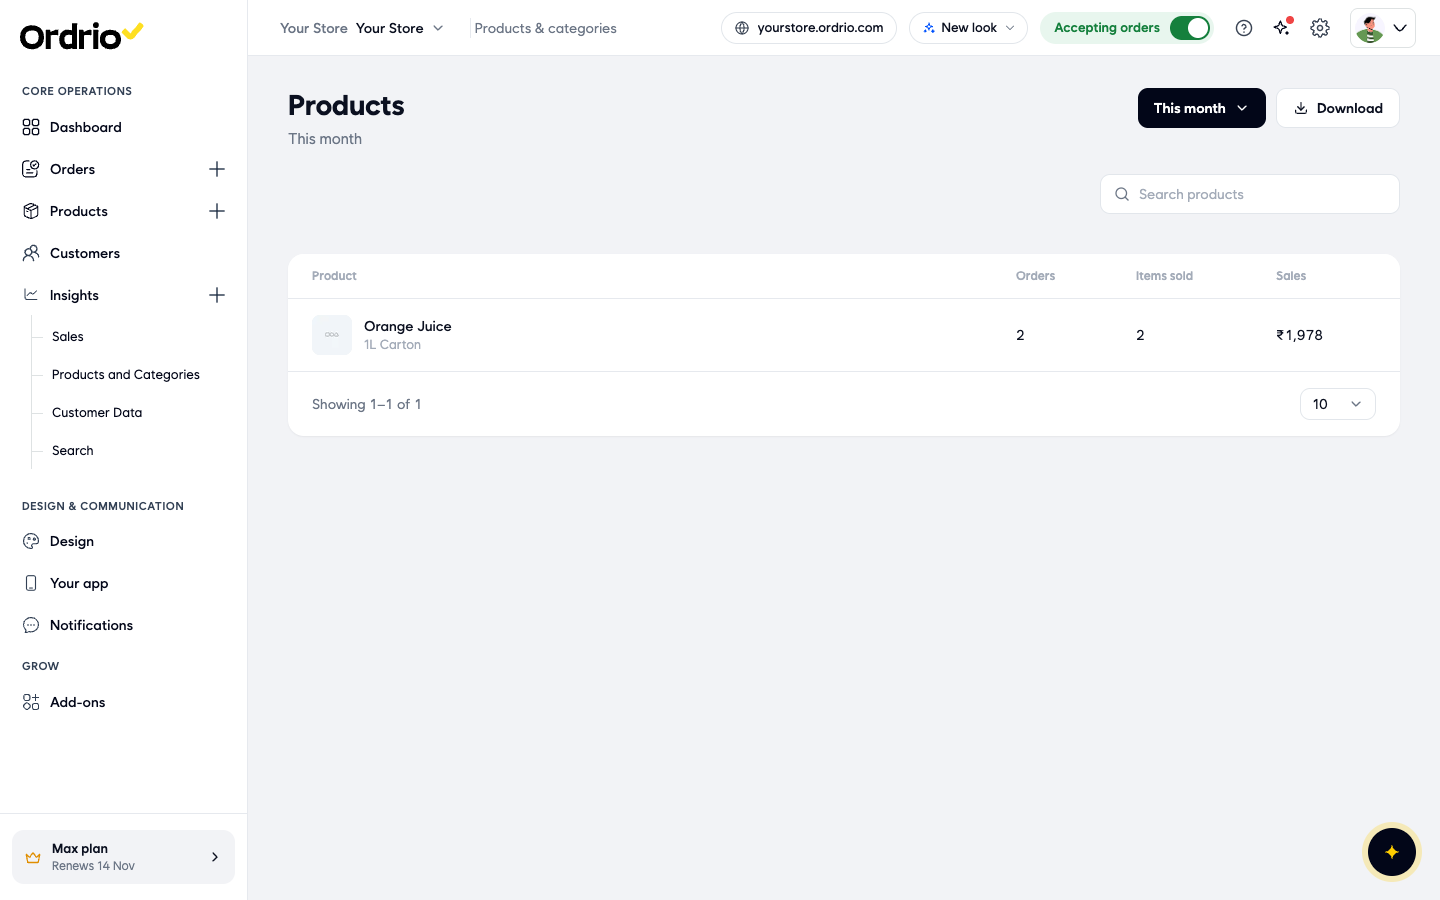
- On the Top products card, click View all. The Products page opens with every product that sold in the period. The columns are:
- Product: the product name, with its size or pack under it.
- Orders: how many orders included this product.
- Items sold: how many units were sold in total.
- Sales: the money this product brought in.
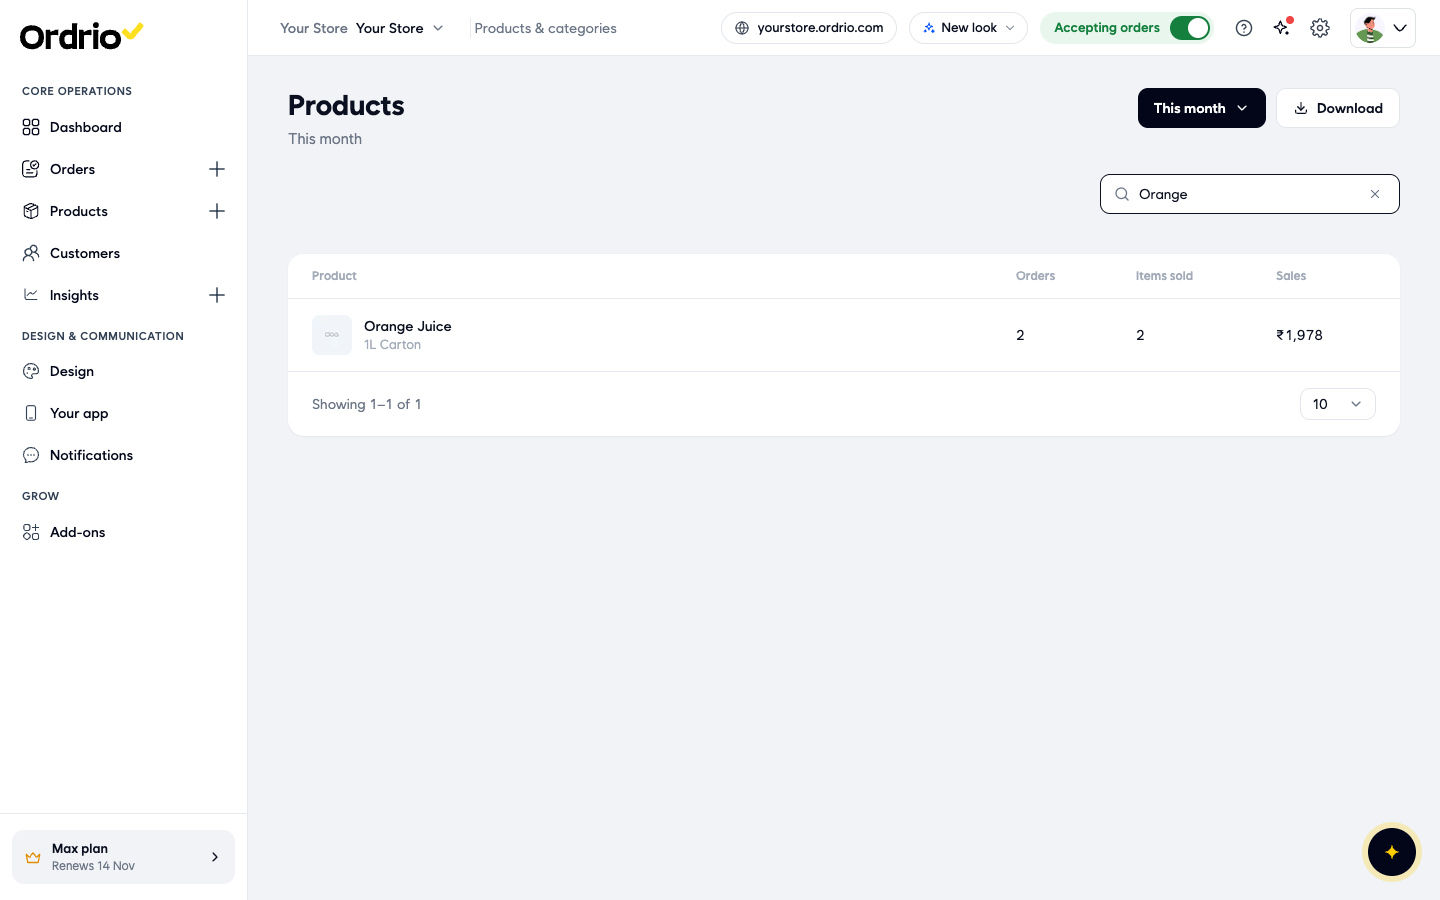
- To check one product, type its name in Search products. The list shows only the products that match. Click the x in the search box to clear it.
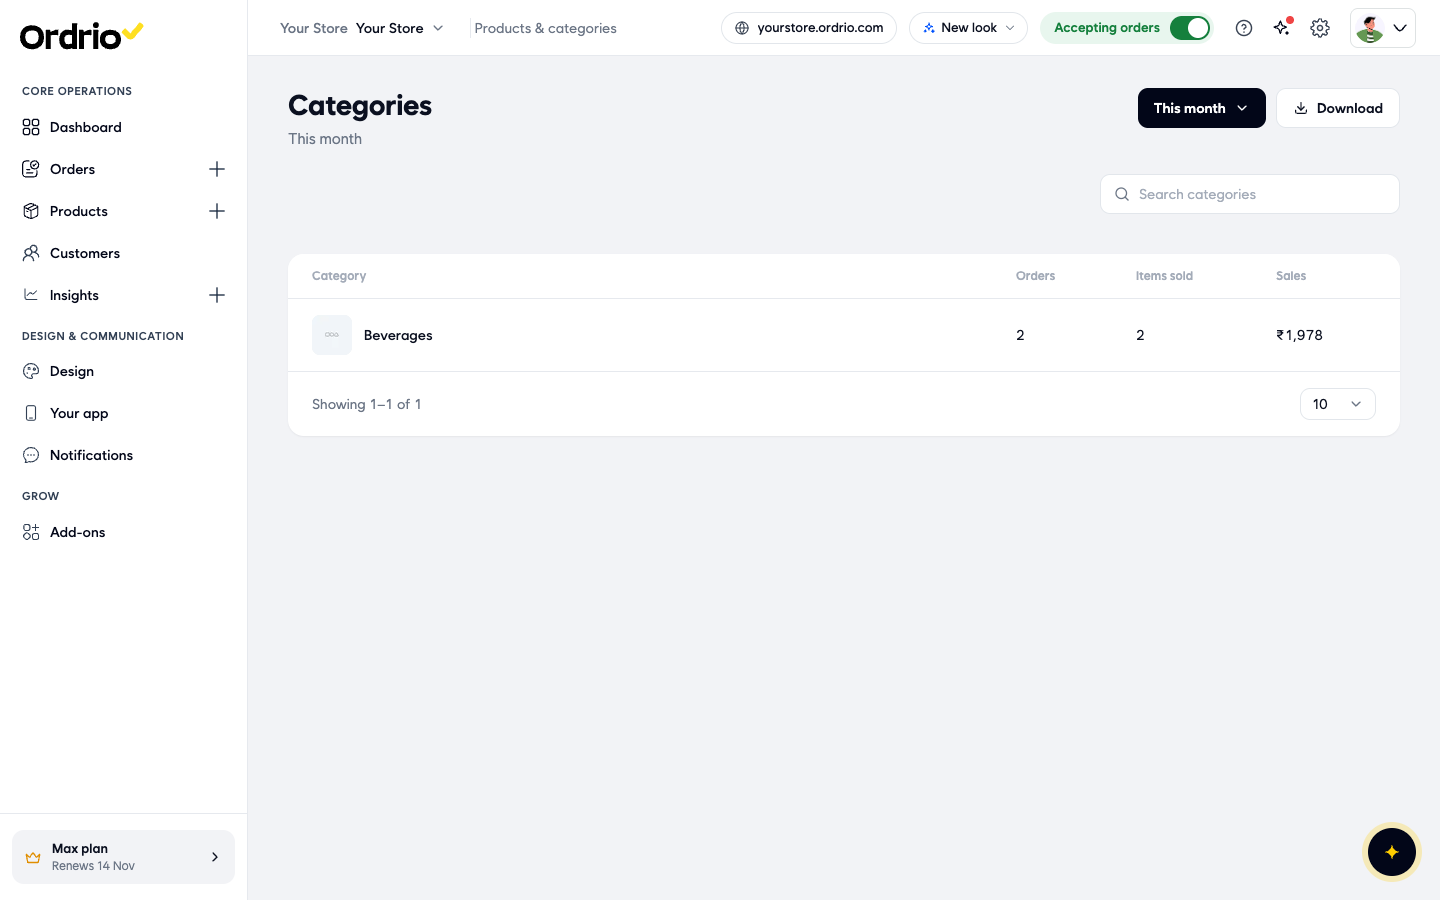
- Pick the time period with the time period button at the top right. This page has its own period and starts on This month, even if you chose another period on the page before.
- To see more products on one page, change the number at the bottom right (5, 10, 20, 50 or 100 rows). The text at the bottom left, for example "Showing 1–1 of 1", tells you how many products are in the list.
- Compare Items sold and Sales down the list. Products with high numbers are your best sellers. Products with low numbers are your slow sellers.
- To keep a copy of the list, click Download.
Find your best and worst selling categories
- Click Products & categories at the top of the page to go back.
- On the Top categories card, click View all. The Categories page opens with the columns Category, Orders, Items sold and Sales. It has the same time period button, Search categories box, rows per page setting and Download button as the Products page.
Good to know
- A product or category with no sales in the chosen period does not appear in the lists at all. If one of your products is missing, it has not sold in that period. These are your worst sellers, so check them in Products and think about a discount, a better photo or removing them.
- Use the same time period when you compare products, for example This month against This month, so the numbers are fair.
- Items sold counts units, and Orders counts orders. Look at both: a product can be in few orders but sell many units in each.
- The search in step 5 is just an example. Type the name of your own product.
Related
- Sales and revenue reports
- Customer reports (new vs returning)
- Adding your first product
- Managing product categories
Was this article helpful?